Water Privatization Aftermath in Armenia:
Scale, Public Perception and
Willingness to Pay
Consecuencias de la privatización del agua en Armenia:
escala, percepción pública y voluntad de pagar

Received: october 3, 2016
Approved: November 27, 2016
PhD in Environmental Sciences and Policy from the Central European University (Hungary). She earned her MSc in Cooperation and Development from University Institute of Advanced Studies (Italy), MSc from the Central European University (Hungary), and MSc from Yerevan University of Management and Informatics. Ms. Harutyunyan has worked at various national and international research and policy entities, as well as the Ministry of Economy and the Armenian Development Agency.
Expert, Development Foundation of Armenia, 5 Mher Mkrtchyan, Yerevan, 0010, Armenia, e-mail: alnarol@yahoo.com
How to quote: Harutyunyan, N. (2016). Water Privatization Aftermath in Armenia: Scale, Public Perception and Willingness to Pay. International Journal of Cooperation & Development. 3(2): 8-22
Artículo resultado de investigación
Abstract
Globalization, the liberalization of international markets and intensification of international cooperation pushed the widespread expansion of privatization of public services. Whether privatization has served the public interest remains unclear. This paper presents the case of Armenia, a country in transition that has undergone an intensive privatization process in the water sector. Top-down assessments show that Armenian utilities reached above-average rankings in international comparisons. Household surveys were used to provide empirical evidence on the real experiences of households through measuring the households’ perception on water services, the willingness to pay and conservation actions. The results shows that households, overall, are satisfied with water services. The highest share of those who are willing to pay for improvements is in rural areas reflecting a greater need for better water services. As expected, the households’ financial situations and the perception of the price of water affect the willingness to pay. The results of the research gave proof to the social comparison theory according to which a lower level of public satisfaction with water services can be derived in areas that neighbor other areas with better water supply services. The study also finds that universal water metering impacted household water consumption behavior.
Key words: Privatization, public perception, water service satisfaction, water consumption, water price, willingness to pay, conservation, water metering, Armenia
Resumen
La globalización, la liberalización de los mercados internacionales y la intensificación de la cooperación internacional impulsaron la expansión generalizada de la privatización de los servicios públicos, aunque no está claro si la privatización sirvió al interés público o no. El documento presenta el caso de Armenia, un país en transición que pasó por un intenso proceso de privatización en el sector del agua. Las evaluaciones, de arriba hacia abajo, muestran que las empresas de servicios públicos armenios alcanzaron una posición superior a la media en las comparaciones internacionales. Se utilizaron las encuestas hechas en los hogares para proporcionar evidencia empírica sobre las experiencias reales de los usuarios, a través de la medición de la percepción que ellos tienen sobre los servicios de agua, la disposición a pagar y las acciones de conservación. Los resultados muestran que los usuarios en sus hogares, en general, están satisfechos con los servicios de agua. La proporción más alta de los que están dispuestos a pagar por mejoras está en las zonas rurales que refleja la mayor necesidad de mejores servicios de agua. Como era de esperar, la situación financiera de los hogares y la percepción del precio del agua afectan la disposición a pagar. Los resultados de la investigación proporcionaron evidencia de la teoría de la comparación social según la cual la menor satisfacción del público con los servicios de agua puede derivarse en áreas que colindan con otras áreas con mejores servicios de abastecimiento de agua. El estudio también encuentra que la medición universal del agua afectó el comportamiento del consumo de agua de las familias.
Palabras clave: Privatización, percepción pública, satisfacción del servicio de agua, consumo de agua, precio del agua, disposición a pagar, conservación, medición del agua, Armenia.
Catalyzed by neoliberal agenda of international development and financial institutions, such as the World Bank and International Monetary Fund, and intensification of international cooperation, the global trade liberalization expanded since the 1990’s (WB, 2005). This led to deregulation and new public management with widespread privatization of public services such as water, energy, health, telecommunication, etc. Said pattern emerged in many countries around the world, especially in countries transitioning to a market economy model of development. The results are controversial: the main question being whether privatization served the public interest remaining unclear (Davidson, 2014; Nicklaus, 2014). Water privatization in Latin America led to water-related conflicts, referred to as “water wars” that gained international attention within the past decades. The most disastrous was the Bolivian case of city Cochabamba, when immediately after privatization Bechtel (US-based corporation) raised tariffs in some cases up to 200%, leaving many poor without access to water. People were even imposed to get licenses to collect rainwater from their roofs. As a result of protests, the company ceased it operation in the country (Boscov-Ellen, 2009). Indeed, opposition to water privatization was worldwide phenomenon with termination of contracts in Birmingham (USA), Debrecen (Hungary), Grenoble (France), Potsdam (Germany), Tucuman (Argentina), etc. (Hall and Lobina, 2008). Hence, in the water policy circle, privatization remains one of the most disputable. Nevertheless, the privatization process is spreading to become the global phenomenon and likely to be at the top of the economic agenda in post socialist region as well.
In this paper, the author presents the case of water privatization in Armenia – a former Soviet country that is going through the transition period. It covers the situation that led to privatization, privatization process, scale and outcomes. The varied setting and experience of a transitional country will provide opportunity to better understand the privatization debate. The results of the paper may also have potential implications for the future of water governance and policy, including the evaluation of factors affecting public perception of water services and their willingness to pay for them, as a means of better managing water services in diverse settings.
Prior to independence in 1991, water infrastructure in Armenia was in a good state. The painful transition featured with a war for historic Armenian lands of Nagorno- Karabakh, blockade from neighboring Turkey and Azerbaijan, energy crisis, collapse of industrial system and networks and connectivity infrastructure brought to deep economic recession. Water infrastructure passed through neglect and under-investment that brought to significant degradation of the water system with high levels of non-revenue water, low hours of supply and low water payment collection rates. The rehabilitation actions for recovering the water system became urgent.
Since the beginning of the 2000s, Armenia has undergone significant reforms in the water governance system based on liberalization principles. Privatization of water systems was among the major components of the transformation processes in the water governance system pushed by donor organizations (Mkhitaryan, 2009; Harutyunyan, 2014a).
As a result, unprecedented rapid and mass privatization was introduced in the water sector. In a decade the privatization level from zero reached 63% of the population receiving water services from water utilities that are operating under the private-public partnership arrangements (Harutyunyan, 2014b). As Figure 1 shows this is an astonishingly high level recording the third after the UK (88%) and France (75%) in Europe where the average is 20.5% of the population (Bakker, 2003).
Figure 1. Level of privatization
Source: Harutyunyan, 2014b
It should be noted that taking into account the critical importance of drinking water supply for human existence, a step-by-step approach of privatization was adopted starting with one utility on short-term based contract with possibility of extension and expansion if the experience is successful. This transitional period of the first privatization contract enhanced confidence for going deeper and wider involvement of the private sector.
Currently, there are four water utilities that provide municipal drinking water in Armenia (Table 1). Yerevan Djur provides services to capital city Yerevan. There are also three regional utilities: Nor Akunq, Lori and Shirak. Armenian Water and Sewage Company (AWCS) covers the rest of the country (Harutyunyan, 2012).
Table 1.
Water utilities, privatization contracts and operators
Utility name | Contractual form | Operator | Service area |
Yerevan Djur | 1) management contract | A.Utility (Italian consortium) | Yerevan city and 32 rural settlements |
2) lease contract | General des Faux, Veolia Water (France) | Yerevan city and 32 rural settlements | |
Armenian Water and Sewerage Company | management contract | Saur (France) | 37 urban and 280 rural settlements |
Nor Akunq | management contract | MVV (Germany) & AEG Service (Armenia) | 12 urban and rural settlements |
Shirak Water and Sewerage Company | management contract | MVV (Germany) & AEG Service (Armenia) | Gyumri city, 38 urban and rural settlements |
Lori Water and Sewerage Company | management contract | MVV (Germany) & AEG Service (Armenia) | 17 urban and rural settlements |
Source: Harutyunyan, 2012
Within this transformation period, considerable improvements were recorded in the provision of water services witnessed by several studies and reports based on top-down assessments (Harutyunyan, 2014b; Mkhitaryan, 2009). Overall, according to the benchmarking study of Harutyunyan (2014b), all Armenian utilities improved their sustainability performance across a number of economic, social and environmental indicators (operational cost coverage, non-revenue water, affordability duration of service hours, etc.) and even succeed in performing well on international level outperforming average international performance. For example, since 2000, the continuity of water services increased from average of 4 to 17 hours of supply per day. The track for the same indicator in the neighboring country Georgia was from 16 to 18 hours per day or in Peru was from 17 to 18 hours. One can see the significant progress made in Armenia within the last decade from the initial worse conditions. From point of view of water consumption efficiency important is also the indicator of water sold that is metered where Armenia is among the world leaders with over 90%, compared again to Georgia with 8%, Peru with 82% or Kazakhstan 70%. It is important to note that metering in Armenia is on apartment or single house level rather than on building level which is the case in most countries (Harutyunyan, 2014a).
At the same time, the lack of comprehensive bottom-up assessments on the situation of water services experienced by people prevents depicting a real situation.
The aim of the present research is to provide empirical evidence about water services on household level. It captures public opinion on water services in Armenia, particularly, measure households’ satisfaction with water services provided by Armenian utilities, assess the willingness of households to pay for improvements and to determine water conservation strategies.
This empirical public opinion research is based on the household survey methodology designed to access public perceptions and satisfaction in relation to municipal water services, the willingness of households to pay for service improvement and water conservation actions. The survey covered in both urban and rural settlements in all marzes (regions) that are served by all water utilities currently operating in Armenia.
The sampling method of the research followed the multistage cluster sampling with preliminary stratification by geographical (water utility service area, administrative regions and urban/rural areas) and demographical characteristics. The survey process was based on the standardized questionnaire administered through face-to-face interviews to ensure proper coverage of target population, higher response rate and opportunity to ask more open-ended questions, including technical ones (Doyle, 2005). Households represented the unit of analysis. The survey got a representative pool of 205 survey respondents. The respondents were informed about the purpose of the study and confidentiality.
Survey data processing and analysis was done using SPSS software. Various statistical tools were employed, including correlation and associations between variables (Pearson’s R, Spearman’s rho, Fisher and Chi-square correlations). The estimations were done with water utility and urban-rural analytics.
The analysis is structured according to several thematic sections. It starts with presentation of general demographic and survey coverage aspects. It then proceeds to the examination of respondents’ satisfaction with water service quality related to several criteria along with utility ranking based on household perception of water service quality. Perception of water payment and burden on family budget are also referred to along with improvements that households find necessary for water services. Finally, willingness to pay more for improved water services is assessed and water conservation actions in case of price increase are identified.
Overall the demographics of survey respondents reflects the actual demographics of the country by urban and rural residents with two-thirds in urban areas, including capital city Yerevan and one-third in rural settlements (Figure 2).
Figure 2. Sample area by settlement type
Source: own elaboration
The research covered areas of all five water utilities: AWSC, Yerevan Djur, Shirak, Lori and Nor Akunq. Figure 3 illustrates the distribution of survey respondents by utilities stratified by the proportion of population served by the utilities.
Figure 3. Respondents by utilities
Source: own elaboration
In the research household satisfaction with water service quality is measured with regard to four main indicators: quality of water, pressure, schedule, schedule and disruption of supply. The survey results show that over 85% of respondents appear to be satisfied with water quality. Among those satisfied, the highest satisfaction (77%) is in Yerevan Djur area, whereas the highest dissatisfaction (75%) is in AWSC area (Figure 4).
Figure 4. Satisfaction with water quality (%)
Source: own elaboration
The ranking of water utilities based on the grouped median measurement of satisfaction with water service quality identifies Shirak as a leader with the smallest Nor Akunq utility registering the lowest score of 2.86 (Figure 5). The F- test with a significance level of 0.000 shows that there is almost no chance that the differences between the mean satisfaction of five water utilities is due to sampling error. The null hypothesis of no difference between the utilities group means is rejected. These results are interesting, because compared to utility level top down assessments (Harutyunyan, 2014b) Nor Akunq was the leader in many assessment aspects. Hence, the household survey research was an important tool to unveil a number of issues that were not possible to trace by top down assessments.
Figure 5. Utility ranking based on median satisfaction with service quality
Source: own elaboration
The analysis of water service satisfaction based on urban and rural variance shows that of those 85% of respondents satisfied with water service 32% are in rural areas (Figure 6). The highest level of dissatisfaction (7%) is in other urban areas. Paradoxically, in rural areas where the quality of services is usually worse and households spend more for mitigating service quality deficiencies, households express higher satisfaction. At the same time, in Yerevan, where water services in general are better, overall satisfaction is lower. This can be explained by higher expectations from water services in areas with less duration compared to the observable districts with longer hours of water supply. Thus, it is not only the comparison with service quality of “before” periods, but also comparison with neighbours are important factors that influence water satisfaction. This is in line with the social comparison theory of Festinger (1954), according to which “people evaluate their opinions and abilities by comparison respectively with the opinions and abilities of others”. This upward comparison (Taylor and Lobel, 1989) with others that are similar but with better condition affects the way of evaluation, in our case satisfaction with water supply services. Based on survey results, it can also be supposed that distance can play a role, which should be a topic for studying further.
Figure 6. Satisfaction with service quality by urban and rural areas (%)
Source: own elaboration
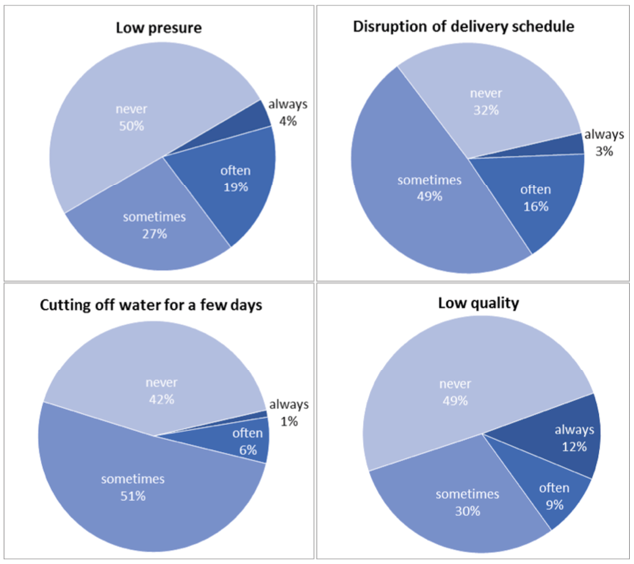
More detailed investigation of problems related with water services illustrates that 30-50% of respondents never faced any problems with pressure, water quality, schedule of water supply or service cutting off (Figure 7). Among all, disruption of water delivery schedule is the most frequent problem. At the same time, 62% of population ware satisfied with water schedule. Unscheduled cuts can interrupt started activities such as taking baths or washing clothes in washing machine causing not only inconvenience but also additional costs of machine failure. In recent year, a new service is being practiced by water utilities of alerting the population through telephone calls, television or special notes in announcement boards in villages about the unexpected changes in schedule or cutting off for longer time.
Figure 7. Public perception of water service related problems (%)
Source: own elaboration
Survey respondents were asked to assess the burden of water payment on their family budget by selecting from the choices provided. The majority of respondents (62%) finds that water payment is a problem for the family but not very serious (Figure 8). For 15% of respondents the payment is a quite serious problem and 1% is not able to pay mostly because of very high debts occurred during the restructuring process, in more details investigated in Harutyunyan, 2016.
Figure 8. Public perception of water service payment burden for family budget (%)
Source: own elaboration
Water survey respondents were asked to indicate improvements for water services (Figure 9). Most frequently mentioned were “water quality improvement” (35%) and “no improvement (30%), followed by “additional hours of supply” (18%), “health risk reduction” (13%) and “wastewater outflow improvement” (11%).
Figure 9. Public perception of water service improvements needed (%)
Source: own elaboration
The result of urban-rural analysis show that in rural and other urban areas “additional hours of supply” is more important than “water quality”. The highest necessity for water quality improvement is registered within Nor Akunq area. “No improvement” is the highest in Yerevan city, reflecting high levels of water services in the capital city.
Half of respondents (50.3%) appear to be willing to pay more for the indicated priority improvements (Figure 10). In Yerevan residents are the least willing to pay, while in rural areas the willingness to pay is the highest indicating the more need for better water services. The main reason for declining is the statement that water fee is already is too expensive and that water is an obligation of utilities or the government to provide proper water services per contract. Respondents also expressed preference to use water containers rather than to have water price increase related with water improvement. Respondents also doubt that price increase will bring the improvements.
Figure 10. Willingness to pay for improvements (%)
Source: own elaboration
Correlation analysis with a number of variables revealed very weak negative correlation with water payment, moderate positive correlation with financial situation of the family and strong negative correlation with water price level satisfaction (Annex 1). Hence, the higher the family’s financial situation and the lower the respondent’s perception of water price level, the higher is the willingness to pay for water service improvements. There is also a moderate positive correlation (Spearman’s rho = 0.248) of the household willingness to pay for water service improvement with the level of urbanization. Hence, the more urban the area the lower the willingness to pay.
The vast majority of survey respondents (63%) reported that they will undertake any actions to minimize water consumption in case of significant water price increase (Figure 11). Those who do not do it (37%) gave explanation that they already conserve water especially after installation of water meters. Since 2004 Armenia passed through massive water metering process and within a short period of time recorded unprecedented results of a near-universal apartment rather than building block level metering with significant water conservation effects (Harutyunyan, 2014a).
Figure 11. Undertake actions to minimize or use water more efficiently (%)
Source: own elaboration
Water conservation actions that the respondents are ready to perform are presented in Figure 12. Over 20 percent of respondents will not use running water for various washing purposes by, for example, filling a dishpan. Next will be reducing the frequency of taking shower (13%), running washing machine only when it is full (12%) and taking shorter shower (9.3%). It seems that many actions will minimize water consumption but at the expense of reduced hygiene practices and worsened health. This is an interesting result. If we compare with conservation action in developed countries, for example, in Canada, the top indoor water conservation action is water conservation devices (85%) which includes low-flow showerheads, toilets and low water-use appliance (Lee, 2009). Hence, any policy in Armenia on water price change should consider subsequent impacts on water consumption and health, taking into account that average water consumption in Armenia is 75 liters per capita per day, which is higher than sufficient basic survival level of 20 liters and meets the requirement of medium-term maintaining but still is not meeting long-term development per WHO standards based on Maslow’s hierarchy of water requirements (Harutyunyan, 2016).
Figure 12. Water conservation actions (%)
Source: own elaboration
The paper presented the case of Armenia that has underwent privatization in the water sector on a large scale. In the short period of time, privatization has extended from zero to 63 percent, recording the third highest level in Europe. Transitional period with step-by-step approach was used to make the privatization process more manageable and acceptable to proceed. While privatization brought significant changes into lives of household with improved water services such as increased and more reliable hours of supply, it did not, however, bring cure for all the problems. Household survey helped to identify a number of issues experienced by households from the bottom-up perspective. Half of respondents reported of never facing problems with water services. Water quality and additional hours of supply and no improvement are the most popular improvements needed and half of respondents is willing to pay for the proposed improvements. Two important factors affecting willingness to pay is water price level satisfaction and financial situation of residents. In case of significant water price increase, households are ready to implement water conservation actions, however, at the expense of reduced hygiene practices that should be properly considered in the water price policy. After universal installation of water meters, households changed their water consumption behavior by conserving and using water more efficiently.
In general, people in Armenia appear to be satisfied with water supply services provided by water companies. Paradoxically, in rural areas where water services are usually worse and people bear more costs for coping with service deficiencies, respondents express higher satisfaction than in urban areas. The research findings approved the social comparison theory according to which lower public satisfaction with water services can be derived in areas that neighbor other areas with better water supply services. Thus, it is not only the comparison with service quality of “before” periods, but also comparison with neighbours are important factors that influence water satisfaction. It can be supposed that distance can play a role, which could be a topic for further studies. Moreover, for regions where due to a number of reasons water supply is by schedule, it is quite important to keep the hours of supply as strictly as possible to let people avoid activity disruptions. Services such as alerting about water schedule disruption should be taken as a strategy enabling households to cope with service deficiencies.
To conclude, even though being “no-choice” option pushed by bad state of water system and conditioned by donors, privatization can bring positive changes in lives of people and overall operation of water utilities, also on international level. However, it is not a silver bullet for all problems. When most urgent problems are solved after initial period, going forward requires more efforts to target specific drawbacks. The household survey research should be employed as an important tool to unveil a number of issues that were not possible to trace by top down assessments. Finally, the results from the research can help the water utilities plan for effective operation and maintenance of their water system.
Annex 1.
Relationship between willingness to pay and other variables
Variables | Level of measurement | Correlation coefficient | Correlation coefficient value | Significance |
Water payment | interval | Pearson’s R | -0.144* | 0.080 |
Storage | interval | Pearson’s R | 0.114 | 0.162 |
Schedule (hours) | interval | Pearson’s R | -0.132 | 0.109 |
Financial situation of family | ordinal | Spearman’s rho | 0.229*** | 0.005 |
Satisfied with water service | ordinal | Spearman’s rho | 0.066 | 0.421 |
Water price level satisfaction | ordinal | Spearman’s rho | -0.309**** | 0.000 |
Schedule disruption problem | ordinal | Spearman’s rho | -0.037 | 0.654 |
Cutting for few days problem | ordinal | Spearman’s rho | -0.160* | 0.051 |
Low pressure problem | ordinal | Spearman’s rho | 0.051 | 0.553 |
Low quality problem | ordinal | Spearman’s rho | -0.134 | 0.102 |
Electric pump | nominal | Chi-square | 1.348 | 0.246 |
No improvement | nominal | Chi-square | 4.905** | 0.031 |
Quality improvement | nominal | Chi-square | 0.532 | 0.466 |
Health risk reduction | nominal | Chi-square | 0.030 | 0.862 |
Additional hours of supply | nominal | Chi-square | 0.516 | 0.473 |
24 hours of supply | nominal | Chi-square | 0.926 | 0336 |
Convenient schedule | nominal | Chi-square | 0.046 | 0.830 |
Proper pressure | nominal | Chi-square | 4.836** | 0.028 |
Central water system for all | nominal | Fisher | 0.120 | |
Better drain cleaning | nominal | Fisher | 0.209 | |
Reducing cost of services | nominal | Fisher | 0.620 | |
Installation of meters | nominal | Fisher | 0.497 | |
Pipe restoration | nominal | Chi-square | 0.001 | 0.981 |
Loss prevention | nominal | Fisher | 0.497 |
*. Correlation is significant at the 0.1 level; **. Correlation is significant at the 0.05 level;
***. Correlation is significant at the 0.01 level; ****. Correlation is significant at the 0.001 level.
References
Bakker, K. (2003). Good governance in restructuring water supply: a handbook. Federation of Canadian Municipalities, Ontario.
Boscov-Ellen, L. 2009. Thirst for Profit: Corporate Control of Water in Latin America, Council on Hemispheric Affairs. URL: http://www.commondreams.org/views/2009/06/20/thirst-profit-corporate-control-water-latin-america
Chia, G. et al. 2007. Water Privatization in Manila, Philippines Should Water be Privatized? Economics & Management in Developing Countries, INSEAD, URL: http://www.circleofblue.org/wp-content/uploads/2012/06/Insead_Water_Privatization_Manila_Philippines.pdf
Davidson, S. (2014). Why is privatization so controversial. Policy, Vol. 30 No. 1, Autumn 2014, URL: https://www.cis.org.au/app/uploads/2015/04/images/stories/policy-magazine/2014-autumn/30-1-14-davidson-sinclair.pdf
Doyle, J. K. (2005). Face-to-face surveys. In B.S. Everitt and D. Howell, eds., The Encyclopedia of Statistics in Behavioral Science. New York: Wiley.
Festinger, L. (1954). A Theory of Social Comparison Processes. URL: https://www.humanscience.org/docs/Festinger%20(1954)%20A%20Theory%20of%20Social%20Comparison%20Processes.pdf
Hall, D. and E. Lobina. (2008). Water privatization. Public Services International Research Unit, London. URL: http://gala.gre.ac.uk/1704/1/PSIRU_Report_(9820)_-_2008-04-W-over.pdf
Harutyunyan, N. (2012). State versus Private Sector Provision of Water Services in Armenia. Frontiers of Environmental Science and Engineering, Vol. 6, p. 620-630.
Harutyunyan, N. (2014 a). Metering drinking water in Armenia: The process and impacts. Sustainable Cities and Society, V 14, p. 351-358.
Harutyunyan, N. (2014 b). Alternative partnership models for water governance: a case study in Armenia. WIT Transactions on Ecology and the Environment, Vol. 191, p. 1609-1620, WIT Press, Arshurst, UK, ISSN 1743-3541, doi:10.2495/SC141372. URL: http://www.witpress.com/elibrary/wit-transactions-on-ecology-and-the-environment/191/29628
Harutyunyan, N. (2016). Public perception of water price and service quality: An empirical analysis of household water delivery in Armenia. Armenian Journal of Economics, Vol. 2, pp. 1- 40.
Lee, T. (2009). A Survey of Public Perceptions and Attitudes Towards Water in Wheatland County. Miistakis Institute, Calgary. URL: http://www.rockies.ca/files/reports/A%20Survey%20of%20Public%20Perceptions%20and%20Attitudes%20Towards%20Water%20in%20Wheatland%20County.pdf
Mkhitaryan, L. (2009). Towards Performance Based Utility Sector in Armenia: Case of Drinking Water Supply Service. The Caucasus Research Resource Centers – Armenia. Research #C08-0198.
Nicklaus, D. (2014). Privatization is common but still controversial. St. Louis Post-Dispatch. Feb 11, 2014 URL: http://www.stltoday.com/business/columns/david-nicklaus/privatization-is-common-but-still-controversial/article_cf1bb072-da21-542f-8fd1-e8ec002f9ed7.html
Taylor, S. and M., Lobel.(1989). Social Comparison Activity Under Threat: Downward Evaluation and Upward Contacts, Psychological Review, Vol. 96, No. 4, 569-575. URL: https://taylorlab.psych.ucla.edu/wp-content/uploads/sites/5/2014/10/1989_Social-Comparison-Activity-Under-Threat.pdf
World Bank (WB). (2005). Trade Liberalization: Why So Much Controversy? In Economic Growth in the 1990s. URL: http://www1.worldbank.org/prem/lessons1990s/chaps/05-Ch05_kl.pdf