
Scientific Research Article
Perspectivas del desarrollo de industrias manufactureras en Nepal
Surendra Kumar Bohara*
Dinesh Raj Bhuju**
Tikeshwori Bohara***
Fecha de recepción: 6 de abril de 2018
Fecha de aceptación: 4 de mayo de 2018
* Surendra Kumar Bohara
Social Activist, Researcher and Businessman. His academic qualifications have now grown up to Ph.D (2018). He has completed his schooling and higher secondary level with first division from Far-west part of Nepal. He did bachelor’s degree in Public Health (BPH) from Pokhara University (2010-2014), Nepal becoming University topper of BPH program. He turned his academic faculty from health to humanities and social sciences while doing his Master’s in International Cooperation and Development (MICD), from Mid-western University, Nepal (2015-2017). Mr. Bohara is enrolling as Ph.D scholar at Tribhuwan University, Nepal. Research is his career mainstream. Correo electróico: awish.suren@gmail.com. ORCID ID: 0000-0001-7599-5629
** Dinesh Raj Bhuju
Academic chief at Master’s in International Cooperation and Development (MICD), Mid-western University, Nepal. Dr. Bhuju did his Master’s degree in Botany from Tribhuwan University, Nepal (1978-1982). He did his Ph.D in Ecology with Distinction from Chiba University. Dr. Bhuju has worked as Technical Advisor at Tribhuwan University central department of Environmental Science. Correo electrónico: dinesh.bhuju@cdnpavia.net. ORCID ID: 0000-0003-2791-9212
*** Tikeshwori Bohara
Ms.TikeshworiBohara is enrolling in Master’s degree on Clinical Psychology, and Master’s in Rural Development from Tribhuwan University (TU) Nepal. She completed Bachelor in Social Work (BSW), Psychology as major subject, from TU (2013-2017). Correo electrónico:biteshwori@gmail.com. ORCID ID: 0000-0001-5533-2836
Abstract
This article aims to study relationship between national accounts with industrial growth in Nepal. Qualitative and Quantitative model was used. Timeline data were analyzed to test hypothesis between variables. Data were taken through Key Informant Interviews (KII) and Secondary Review. MS-Excel, and SPSS 21 version were used to enter and analyze data. New terms-inclusiveness, equality and sustainability were clearly undertaken in national development plans since 1956. Newer plans were found undertaking fancy global perspectives without considering national resources and capacity to implement. 74% variability in total industrial employment was brought about by manufacturing with Pearson coefficient 0,865 at 99 % CI. Manufacturing has decreasing trend in its sectorial contribution to GDP, however found positive strong correlation of 0,737 with the GDP growth and per capita GDP. Manufacturing sector have scope to drive national development goal of Nepal.
Keywords: Manufacturing industry, industrial growth, development perspectives, economic development, regression.
Resumen
Este artículo tiene como objetivo estudiar la relación entre las cuentas nacionales con el crecimiento industrial en Nepal, a través de un estudio de enfoque cualitativo y cuantitativo. Los datos de la línea de tiempo se analizaron para probar la hipótesis entre las variables, los cuales se tomaron a través de entrevistas con informantes clave (KII) y revisión secundaria, y se analizaron por medio de los programas MS-Excel y la versión SPSS 21. Los términos inclusión, igualdad y sostenibilidad se asumieron claramente en los planes nacionales de desarrollo desde 1956, a su vez que se encontraron planes nuevos que adoptaban perspectivas mundiales sofisticadas sin considerar los recursos nacionales y la capacidad para implementarlos. La industria manufacturera, medida con el coeficiente de Pearson 0,865 al 99% CI produjo una variabilidad del 74% en el empleo industrial total. Adicionalmente, la industria manufacturera tiene una tendencia decreciente en su contribución sectorial al PIB, sin embargo, encontró una fuerte correlación positiva de 0,737 con el crecimiento del PIB y el PIB per cápita. Por último, el sector manufacturero tiene alcance para impulsar el objetivo de desarrollo nacional de Nepal.
Palabras claves: Industria manufacturera, crecimiento industrial, perspectivas de desarrollo, crecimiento económico, regresión.
I. Introduction
History reveals about Industrial revolution (1200-1860) in Britain and expansion all over the world (Szirmai, 2012). Today’s development is being considered synonymous with industrial growth (Szirmai and Verspagen, 2010; Kniivila, 2008). Meaning of ‘development’ till mid of 19th century was measured with the economic growth indicators (Pieterse, 2010), which is still pertinent. ‘Development’ as such is practiced to enhance the level of income and well-being thereby reducing the inequalities (Alonso& Glennie, 2015).So far meaning of development in the world paradigm reached to sustainability, human right based approach from 1800s’ catching up concept (Pieterse, 2010; Willis, 2005). More than need for economic development, industrial growth is vital for the poverty reduction, employment creation, globalization, balanced growth, infrastructure development, human resource development, self-reliance and well-being (MoICS, 2002). Development perspectives in industrial sector have bring about structural changes, thereby creative destruction of norms and values through innovative technologies (Kniivila, 2008).
The concept of Kamane Akamastu writing on “A Historical Pattern of Economic Growth in Developing Countries”, has shown ‘post-colonization liberalization’ as tuning fork in policy formulation in industrial sector of developing nations. New rise in the ‘economic nationalism’ of a country was brought about based on various seven stepwise struggle for economic development (Akamatsu, 1962).First of which was struggle with the colonial (British) model of development, and the seventh was of export-oriented nationalism in economic goods. Development plans are considered as baseline for undertaking development decisions in Nepal. So far fourteen development plans have been implemented since 1956. Industrial Growth in Nepal has not so long history. The earliest period, befor1956, was ‘catching up’ to the developed nations. There was an imitation of the functions and practices from developed nations. During 1950s and 1960s China and Soviet Union have helped to establish industry in Kathmandu (CBS, 2014). Later, Industrial Estate began with establishment of Balaju Industrial Estate in 1963 on the joint effort the Government of Nepal and USAID to attract the private sector for making business investments in the industry sector. After the provisions of infrastructures like transport, power and communication and institutional arrangement, Nepalese industrial growth process is getting new shape. National Industrial Development Corporation (NIDC) was institutionalized in 1959 as financial and technical assisting government organization. It was only after 1980s that Nepalese economic reform took place with special consideration in industrialization. Until 1990, only 15 manufacturing industries were registered under industrial department. Again, in FY 2004/05 the number of industries were only 3,180. Up to the FY 2014/15, a total of 386,135 industries were found registered, of which 758 were of large scale, 1,387 were medium scale, 3,808 were of small scale and 380,182 of micro scale. In 2016, total of 5,646 industries were registered as: agro and forestry based, service, manufacturing, construction, energy based, mineral and tourism. Under manufacturing sector, 2,585 industries were registered in industrial department (MoF, 2016). Manufacturing industries remains dominant in all 11-industrial estate of Nepal. They are also supporting employment for more than 2,771,309 employee. With the shift in practices, there were also changes occurring in values, culture and norms. This newer development perspectives to industrial growth have lead country into new transformation of productive means. Newer ‘development perspectives’ has been applied for welfare based economic development (social equity and equality, inclusiveness, sustainability), and the economic measurement indicators viz. GDP, per capita, gross output, value added, and employment. Based on dynamic characteristics of economic development, Nepal has also changed its policies, plans and approaches in various timelines.
Gender Equality and Social Inclusion (GESI) approach is new concept undertaking in Nepalese development practices (Adhikari, 2013; MoUD/GoN, 2013). It focuses on the need for action to re-balance the power relations, and ensures equal rights, opportunities and respect for all individuals regardless of their social identity. So far, GESI has been focused on improvement of inequality issues on sectors such as: institutional arrangement (Ministry of Women, Children and Social Welfare), citizenship provision, property rights laws, Employment and labor migration, Health and education, social security, transport, etc. Provision of inclusive industrial growth has been made through Nepalese government’s fourteenth development plan (NPC, 2017) as well as from Sustainability Development Goals (SDG) number nine (ICSU, 2015; UN, 2015). GESI perspectives in manufacturing industrial setting is new approach to research.
Development perspectives have now shifted from its only economic measurement, mapping now considers the indices of National Accounts as whole. The concept of measuring development through Gross Domestic Product (GDP), per capita Income, Gross Output (GO), Gross Value Added (GVA) are the results of new insight from economic development theories of modernization, Globalization, Liberalization, privatization (Willis, 2005; Pieterse, 2010). National accounts reflect the progress in the betterment of people’s life. Employment, GDP, Per capita income, GO and GVA are the macroeconomic indices provided by achievement in development so far (UN, 2003). GDP, Per-capita income, GVA and GO are the development perspectives to measure the human development status of the country (Khodabakhshi, 2011). National accounts have been measured in consideration with basic three sectors viz. agriculture, services and industry. Industrial contribution to above mentioned national accounts has been traced both in increasing and decreasing time trends (Ministry of Finance, 2016). However, the employment statistics created by industrial sector are bigger than other two sectors.
Literatures found were only revealing the percentage contribution of industrial sectors in national accounts, however research gap was there on hypothetical analysis of their relationship. The correlation and regression modeling between national accounts and manufacturing sectors are thus scope under this research. Theoretical provisions on manufacturing industries, made by fourteen development plans, were analyzed followed by statistical analysis of relationship between manufacturing and national accounts. This paper has limitations on unavailability of timeline data (only data from 2001 to 2016 were taken). Also, study does not undertake the comparisons among other sectors (Agriculture and service) of GDP calculation.
This article thus reviews and analyzes the relationship between development perspectives and manufacturing industrial growth in Nepal. More specifically, based on periodic development plans, this paper reviews the perspectives on industrial growth. Following hypothesis were under taken to analyze correlation and regression models:
II. Methodology
Research has used both qualitative and quantitative research designs. Analytical cross-sectional research type was used. ‘Industry’ as unit of study was taken to analyze and interpret data. Under dependent variables- GESI approach and macroeconomic national accounts were used. Similarly, under independent variables manufacturing industrial characteristics such as: number, employment and other microeconomic indicators contributed from industrial sectors were used. Primary data were collected through Key informant Interview (KII) technique, and KII guideline as tool, and Secondary data were collected based on secondary review format. Secondary quantitative data were taken from 2001 to 2016 for statistical testing, while those qualitative data were taken based on various periodic development plans of Nepal. This research presents theoretical analysis of new development perspectives provisioned under fourteen development plans followed by statistical analysis between manufacturing and national accounts.
Thus, collected data were entered in MS-Excel. Analysis was done separately for Qualitative and Quantitative Data. Qualitative data were analyzed using thematic analysis method. Quantitative data were collected on the basis of time (year), and they were entered in excel. Data were imported in SPSS 21 version. First of all data editing and cleaning was done. Time series data were checked through various reports for valid information on dependent and independent variables. Dependent variables (DV) were checked for normal distribution through histogram normality curve plot. DV and Independent Variables (IV) were then looked for unit root, autocorrelation, multicollinearity and heteroscedasticity in SPSS. SPSS version 21 was used to test hypothesis using bivariate correlation and linear regression at 99 percent confidence level and 95 percent confidence level respectively. Validity and reliability of data and tools was tested through pre-testing, and consistency and accuracy testing. Ethical approval was taken from Mid-Western University Ethical Review Board, Nepal.
III. Results
The inception of national periodic development plans, since 1956, was with the motive of fulfilling definite development goals. However, period before planned development was like: independently struggling nation, haphazard of problems, political unrest, unmanaged resources, primitive means of production, poor technology, poor knowledge, lack of development policies, lack of destination and goal. National Planning Commission (NPC) was lead agency providing the directions for the industrial growth in the country. Under these 14 development plans, focus of development were presented with definite objectives, goals and strategies.
Initiation of planning in development was new march towards socio-economic development. The initial (1960s) planning were short-sighted, problem-solution based, focused on understanding situation rather than intervening; more theoretical than practical ones. The undertaking of various planned period, and their perspectives for industrial have been presented in following table 1 below. The concept of inclusion and equality were found still virgin in the manufacturing sector. Development plans were found unspecific about provisions for Gender Equality and Social Inclusion (GESI) in industrial sector. Key Informants were found disclosing the enforcement of ‘inclusion’ principles in industrial setting might be because of ‘privatization’ in the field. Private industrial institutes were found noncomplying to the GESI approach, however sustainability was highly praised and prioritized issue.
The initiation of planning was much oriented on the creation of infrastructure for manufacturing. It was clear that country can leads to development category via its socio-economic progress. For this, road, electricity, education, transport and communication were important substances to be uplifted. Meantime, ‘privatization’ was learned from external development practices and included in national plans. Concept of sustainable development was realized since 4th development plan, 1970s. The perspective of egalitarian development and regional balance were found significantly addressed during fifth plan afterward.
The period of 1985 was transformation of the protectionist regime into more liberal perspective in industrial field. More liberal and welfare based economic growth can be traced after 8th periodic plan. This is indisputable fact that the development of industrial sector plays an important role in the economic growth rate of a nation (NPC, 1992). The true definition of the industrial development can be quoted from the eighth plan as the ‘mobilization of labor, capital and the available natural resources towards the industrialization. 9th and 10th plan were focused on the poverty reduction. 10th development plan was found highly influencing on sustainability aspect of industrialization. Human right, women, children and social welfare, decentralization, peace and security issues were more focused in the 10th and 11th plan. A new thought on the enhancement of Quality of life of people was major social goal of the plan. Initiation of welfare-oriented economic development through Public Private Partnership (PPP) was initiated. The long term perspective of the plans later to 11th was “to create an industrial climate with the capacity to compete in the global economy ensuring high and sustainable growth rate”. New promises were made like: revision in policies, ease on procedure of registration, establishment of ‘one stop service center’, effective selection mechanism to ensure participation of women, Dalit, Adibasi, Janajatis, the poor and backward groups, and those affected by conflicts. New themes on “Be Entrepreneur, Reduce Youth Unemployment” and “One village One Product” were initiated in 11th plan, and more focused in 14th plan. “A review of Trade and Industrial Policy in Nepal” (2007) was found highlighting on the changing patterns of government’s involvement in the market regulation along with the industrial progress (Pradhananga, 2007). Government’s role was defined as facilitator, coordinator, promoter and monitor in this 11th plan. Provision of Special Economic Zones (SEZ) came into existence.
The Asian Development Bank (ADB) report, 2010, also suggests implementation of Inclusion approach in industrial setting is best way to create employment and uplift the standard of living of those people (ADB, 2010). With this inspiration Nepalese development plans particularly, thirteenth one focuses on more inclusive and gender mainstreaming employment in industrial settings. However, the inclusive and gender provision of employment was only based on cottage and small scale industries and enterprises (Adhikari, 2013; NPC, 1992). The current 13th and 14th plans were more focused on attaining the developing status by 2022 through inclusive economic growth and GESI mainstreaming (MoF, 2016; NPC, 2017). INCLUDE program of Government is promoting the inclusive industrial development of the country. (Adhikari, 2013) During the entire periods, emphasis has been laid on production, employment generation, and poverty reduction, balanced and inclusive development, among others along with aim of graduation of country from underdeveloped to developing one by 2022 (GoN/NPC, 2014). Human development report also found considering the role of productivity sector in human development. The exact phrase used in Nepal Human Development Report 2014 were found:
“Productivity increases are vital for sustaining high growth, which is a principle basis for economic advancement and improvement in people’s well-being” (Sharma, Guha-Khasnobis, & Khanal, 2014).
However, there have been critics in inaugurating fancy development terms in national development plans without their proper studies. For instance, the agenda of ‘privatization’ was continuing since first development plan (1956). The ambitious goal of reaching prosperity through general well-being and people’s welfare were since first and second plans. Similar in the case for industrial development. There have been found lots of imitation in the promises for developing industries. The wording imitation was chosen without consideration in national capacity and resources for implementation. The inspirations carried out by first development periodic plans does not found reflecting on 14th plan, rather Nepalese manufacturing sector is struggling with similar pace and issues along all plans.
Table 1 Development Plan Perspectives of Manufacturing Industries in Nepal | ||
Development periodic plans and their period | Overall Development Perspectives | Provision for Equity, Equality, inclusiveness, and Sustainability |
First plan (1956-61) | To raise- production, employment, standard of living, and general wellbeing; industries were without any proper preparation, financing, management, and knowledge of industrial processes and marketing; initial planned step towards modern industries; privatization | No such provisions, but undertaken with the ambitious objective of industrial growth. |
Second plan (1962-65) | To promote welfare of people through economic growth; industrial infrastructure building; social welfare focused; | Elimination of discriminations based on income, caste, religion and sex. Economic sustainability; |
Third Plan (1965-70) | Economic development; Infrastructure building; expand industrial estates; import substitution and export promotion; | No such documented provisions |
Fourth Plan (1970-75) | Production for economic growth; 3rd priority; labor intensive growth; revision of policies; institutional strengthening; industry categorization; | Equitable economic growth; labor welfare. Build the necessary base for sustainable development |
Fifth plan (1975-80) | Linked core and periphery into national socio-economic system; self-reliance and import reduction policy; industry expansion; council formed; | Egalitarian development; regional balance; Ministry of Labor established Only legal perspectives; |
Sixth Plan (1980-1985) | Widening national economy and its growth; infrastructure development; labor unrest; shortage of power supply | Women development was focused; Legal perspectives |
Seventh plan (1985-90) | Attain higher growth rate; fulfill basic need of people; overcome power shortage; import substitution and export promotion; social welfare approach; | Labor wages was set; Access the status of women in industries; Long term policies and plans |
Eighth Plan (1992-95) | Democratic perspectives; globalization; liberalization; agricultural diversification; | Labor act; gender balance; Decentralization; training to backward ethnic community. Environmental and financial perspective |
Ninth plan (1997-2002) | Poverty reduction; strengthen financial system; market diversification based on comparative advantage; labor administration and trade union; labor safety; insurance, pension, incentives | Economic and social equality; Inclusion of poor and backward, gender; Natural environment; long term perspective on GDP contribution |
Tenth Plan (2002-2007) | Millennium Development Goals (MDG) guided; priority to privatization; Capability focused; poverty alleviation; quality of life focused; | Gender equality; economic status; Caste wise, class wise inclusive dev.; Prioritized |
Eleventh plan (2007-10) | Interim; unrest and insurgency; goal of prosperous, modern and just Nepal; focus on relief, rehab, and reintegration; welfare based PPP; one stop service center; One village one product (OVOP); Special Economic Zones (SEZ) | Gender mainstream; employment for all; Inclusion on employment based trainings; Pro-poor and sustainable economic growth; |
Twelfth plan (2010-13) | Upgrade country; socio-economic transformation; MDGs; employment creation; economic nationalism; SEZ, industrial estate; institutional arrangement for standardization; one stop service center; | Women Employment; Inclusive selection process in Employment; Sustainable changes in life of people; sustainable growth |
Thirteen plan (2013-16) | Upgrade country by 2022 to developing one; MDG focused; SEZ; intellectual patient right; cottage and small industry focused; economic nationalism; | Prioritized (GESI); Training to backward population and their involvement in employment; Highly prioritized in plans and programs |
Fourteenth plan (2017-19) | SDG inspired; self-reliant economy; economic nationalism; ODOP; FDI; young entrepreneurs; | Major focus and consideration on equitable and inclusive development Sustainability At core of development activities |
Source: Author Compilation from National Planning Commission (NPC, 1956-2017) | ||
Growth in number of manufacturing sector was found very slow in Nepal. In 1989, out of just 46 industrial set ups, only 15 were of manufacturing types. However, the employment occupancy from manufacturing was found almost 50 percent of all industrial employment. 15 manufacturing industries were found employing 1,717 employee in 1989, while in 2016 out of total 479,846 employments by overall industries, manufacturing have 274,577 employment opportunities. Literatures suggest for huge scope for employment in manufacturing sector in Nepal (Szirmai and Verspagen, 2010; CBS, 2014; MoICS, 2002). However, literatures testing correlation between employments created by manufacturing with overall industrial employment were limited in Nepal. This analysis used employment data from 1989 to 2016, and hypothesis was set as:
Null (Ho): There is no relationship between total employment in industrial sector and total employment created by manufacturing.
Alternative (H1): There is relationship between total employment in industries and manufacturing sectors.
Total industrial employment was used as dependent variable and employment in manufacturing was taken as independent variable. There found heteroscedasticity and unit root problem in data orientation. To eliminate the problem, natural log was taken for both variables, and performed in SPSS. Hence, the analysis found strong positive bivariate correlation of 0.865, significant at 99 percent confidence internal with 0.01 percent margin of error as shown in table 2 below. We accept the alternative hypothesis stating that there is strong positive relationship between manufacturing and total industrial employment.
Correlations between Employment in Manufacturing and Total Industrial Employment | |||
| Total industrial employment | Employment in manufacturing | |
Total industrial employment | Pearson Correlation | 1 | .865** |
Sig. (2-tailed) |
| 0 | |
N | 25 | 25 | |
Employment in manufacturing | Pearson Correlation | .865** | 1 |
Sig. (2-tailed) | 0 |
| |
N | 25 | 25 | |
**. Correlation is significant at the 0.01 level (2-tailed). | |||
Again, the regression model summary between total industrial employment and manufacturing employment shows almost 74 percent variability in the total industrial employment was because of manufacturing employment as shown in table 3 below.
Table 3: Regression Model Summaryof Employment in Manufacturing and Total Industrial Employment | ||||
Model | R | R Square | Adjusted R Square | Std. Error of the Estimate |
1 | .865a | 0.748 | 0.738 | 0.30468 |
Predictors: (Constant), Employment in manufacturing | ||||
As shown in the linear regression equation between total industrial employment and employment from manufacturing was found as:
Log (total industrial employment) = 3.57+0.68 log (manufacturing employment)
This means at 95 percent CI; the relationship predicts that the one unit increase in employee in manufacturing can bring about 68 percent raised in total industrial employment. The linear relationship was found significant 0.000 at t-value 8.27 and standard error of 0.083 as shown in table 4 below.
Table 4 Regression Coefficients of Employment in Manufacturing and Total Industrial Employment | ||||||
Model B | Unstandardized Coefficients | Standardized Coefficients | t | Sig. | ||
Std. Error | Beta | |||||
1 | (Constant) | 3.567 | .739 | 4.829 | .000 | |
Employment in manufacturing | .683 | .083 | .865 | 8.272 | .000 | |
Dependent Variable: Total industrial employment | ||||||
While at one hand literatures suggests for high unemployment rate of 3.2 percent, manufacturing sector was found contributing employment for large population. It is more labor intensive so far. Manufacturing industries in the LDCs are growing at an average of 7.2 percent annually (ILO, 2014), which means employment created by them is also increasing. At the global level, Kapsos (2005) found that for every 1-percentage point of additional GDP growth, total employment has grown between 0.3 and 0.38 percentage points during the three periods between 1991 and 2003 (Kapsos, 2005). Similarly, literature review by Basnett and Sen (2013) identifies an extensive body of evidence which suggest that growth in manufacturing and services have particularly positive impact on employment.
The development goal of Nepal envisions to reach ‘developing’ category by 2022, for which main challenge is perceived as economic growth, particularly per capita income. The per capita income of Nepalese has been objected to reach NRs. 116,500 by the end of fourteenth development plan (NPC, 2017). The operational definition of development can be found including economic terms as such: GDP, Per capita income, annual economic growth rate, Gross output, and Gross value added, etc. Economic growth rates have been envisioned for 6.5 percent, 7.2 percent and 7.9 percent in fiscal year 2016/17, 2017/18 and 2018 /19 respectively (NPC, 2017).
From projection between 2013/14 to 2021/22, industrial sector was found with average growth of 10.1 percent. The GDP however is growing at an average of 9.2 percent. Industrial sector was expected to contribute GDP by almost 10 percent. The total contribution to GDP from Industrial sector was found to be 15.4 percent, whereas by manufacturing from its subset was 6.3 percent. Talking about the GDP contribution, till the eighth plan period, industrial contribution to GDP was 5 percent, and 2 percent employment to total population (MoICS, 2002). Contribution of manufacturing industries in the GDP of Nepal found in decreasing trend from 8.2 % in 2003 to 5.5 % in the 2016 as shown in figure 1 below. Manufacturing sector composition of GDP before 2000 AD was 9 percent (CBS, 2001-15). The reasons for this deceasing role of manufacturing on GDP could be the concern of further studies.
Nepal’s GDP stands at 7.5 percent annual growth (21.14 USD Billion) in 2016, which lies in world’s seventh ranking of growth. Out of this, the manufacturing sector contributes by NRs. 48,510 million (Economics, 2016). In developing world, the manufacturing sector share in the GDP has remained stable over the last 40 years (UNIDO, 2015). Economies of South Asian countries other than Nepal and Maldives that grew positively in 2015 as compared to its preceding year is expected to grow in 2016 as well but that of Nepal and Sri Lanka. Economies of two giant Asian countries: India and China, which rose by 7.3 percent and 6.9 percent respectively in 2015, are projected to grow by 7.5 percent and 6.5 percent respectively in 2016 (MoF, 2016).
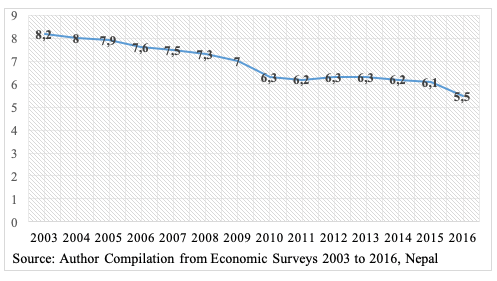
Figure 1. Contribution of Manufacturing Industries in GDP at current price (In percentage)
The secondary data from 2001 to 2016 were used to perform correlation and simple regression analysis. One to one analysis was made with manufacturing sector as cause (independent) and Overall GDP, National GDP growth rate, annual per capita GDP as dependent variables. Following interpretation and discussion were made from analysis:
Annual GDP rate from manufacturing industries have made differences in the economic growth of the nation. For the testing of this, statement of 0.01 level of significance i.e. 99 percent confidence interval (CI) was taken, and following hypothesis was propounded:
Ho: There is no difference in the annual GDP rate contribution made by manufacturing industries in annual GDP growth rate of a country.
H1: There is difference in the annual GDP rate contribution made by manufacturing in annual GDP rate of a country.
The table 5 presented below shows strong positive correlation of 0.737 between GDP growth from manufacturing sector and Annual growth rate in real GDP. Literature suggested unidirectional causality relationship between manufacturing and GDP in India (Singariya & Sinha, 2015).
Table 5 Correlations between Annual GDP Rate Contributed by Manufacturing and Real National GDP Growth Rate | |||
Annual GDP Growth rate by manufacturing | Annual GDP growth rate | ||
Annual GDP Growth rate by manufacturing | Pearson Correlation | 1 | .737** |
Sig. (2-tailed) | .001 | ||
N | 16 | 16 | |
Annual GDP growth rate | Pearson Correlation | .737** | 1 |
Sig. (2-tailed) | .001 | ||
N | 16 | 16 | |
**. Correlation is significant at the 0.01 level (2-tailed). | |||
Similarly, the model summary in table below highlights that the annual GDP growth rate from manufacturing industries can explain 61.2 percent variability in the annual real GDP growth by the country, at standard error of 1.17.
Table 6 Regression Model Summary of Annual GDP rate contribution from Manufacturing and Real GDP | ||||
Model | R | R Square | Adjusted R Square | Std. Error of the Estimate |
1 | .799a | .638 | .612 | 1.16614 |
Predictors: (Constant), Annual GDP Growth rate by manufacturing | ||||
Dependent Variable: Annual GDP growth rate | ||||
The linear regression coefficient table 7 below shows the prediction of Annual GDP growth rate by manufacturing sector growth. The regression line at 95 percent CI between the dependent (annual GDP growth rate) and independent (GDP rate from Manufacturing) variables shows following equation:
Annual GDP Growth rate= 3.445 + 0.357 GDP growth by manufacturing
This means, the one unit increase in growth rate of manufacturing can predict 0.357 unit increase in national GDP growth rate annually at 0.072 standard error and p-value of 0.000.
Table 7 Regression Coefficients of Annual GDP Growth rates between Manufacturing and National Level | ||||||
Model B | Unstandardized Coefficients | Standardized Coefficients | T | Sig. | ||
Std. Error | Beta | |||||
1 | (Constant) | 3.445 | .312 | 11.037 | .000 | |
Annual GDP Growth rate of by manufacturing | .357 | .072 | .799 | 4.967 | .000 | |
Dependent Variable: Annual GDP growth rate | ||||||
Literatures from other developing world shows ups and downs in the correlation between manufacturing and GDP. There were also found decreasing role of agricultural sector in GDP. For instance, the Chinese share of industry in GDP has increased from 35 per cent in 1965 to 46 per cent in 2004 with the declining agricultural share (Kniivila, 2008). There have not been sizable changes in the share of manufacturing (16 per cent in 2005 vs. 14 per cent in 1965) in India. Alike this research findings, literature as such, Rodrik in 2009 regress the GDP rates for five year with industrial share in developing countries and found significant positive relationship with the interpretation that post World-war period brought about the significant structural changes in the production mechanism (Szirmai and Verspagen , 2010). However, the contradictory findings were retrieved from India. Katiria and Raj (2009), and Chakravarty and Mitra (2009), both cited in Szirmai and Verspagen (2010) found that the industrial regions have rapid growth rate followed by services. On the other, Thomas (2009) cited in Szirmai and Verspagen (2010) concluded services is primary motivator of growth. Study conducted by Adam Szirmai and Bart Verspagen (2010) found manufacturing have more influence in economic growth before 1970s. In 2015, study by Dhiraj Jain et.al., regress the relationship between various Indian macroeconomic (FDI, Net FII equity, Net debt, and Import and export factors on GDP, and found the significant relationship between indicators (Jain, Sanal & Jain, 2015).
Global comparison in this research has shown between 1980 and 2011.Per capita income in developing countries grew on average by 3.3 percent per year, which was much faster than the 1.8 percent per capita income growth recorded in advanced economies (ILO, 2014). Least developing countries (LDCs) shows the GDP per capita annual growth rate of -0.1 in 1980-89, 0.3 in 1990-99 and 3.6 in 2000-11 (ILO, 2014). Nepal also lies in LDCs with its average per capita GDP annual change 2.63 percent from 2001 to 2016.Similarly, data from 2001 to 2016 were analyzed for the relationship between dependent (Per capita GDP change) and Independent (annual GDP growth rate by manufacturing). The strong positive significant Pearson coefficient of 0.737 at 99 percent CI was found for two tailed test shown in table 8 below. A global study was conducted on relationship between sectorial shares and per capita GDP from 1950-2005, found manufacturing as important driver of per capita (Szirmai and Verspagen, 2010). Studies comparing causality at local level in Nepal were not found for discussion in this paper.
Table 8 Correlations between Annual GDP Growth Rate by Manufacturing and Per Capita Change in GDP | |||
Annual GDP Growth rate by manufacturing | Annual change per capita GDP | ||
Annual GDP growth rate by manufacturing | Pearson Correlation | 1 | .737** |
Sig. (2-tailed) | .001 | ||
N | 16 | 16 | |
Annual change in per capita GDP | Pearson Correlation | .737** | 1 |
Sig. (2-tailed) | .001 | ||
N | 16 | 16 | |
**. Correlation is significant at the 0.01 level (2-tailed). | |||
The regression model summary shows the independent variable in the study i.e. annual GDP rate by manufacturing is moderate estimate of dependent variable i.e. annual per capita change in GDP. With the standard error of 1.56 GDP growth rate by manufacturing can explain 51 percent variability in annual per capita GDP change.
Table 9 Regression Model Summary of Annual GDP Rate by Manufacturing and Annual Per Capita GDP | ||||
Model | R | R Square | Adjusted R Square | Std. Error of the Estimate |
1 | .737a | .544 | .511 | 1.55809 |
Predictors: (Constant), Annual GDP Growth rate by manufacturing | ||||
Dependent Variable: Annual change in per capita GDP | ||||
The relationship between these mentioned variables in table 10 shows the linear regression equation of:
Per capita GDP= 2.02 + 0.392 (GDP growth by manufacturing)
This means one unit increase in rate of GDP from manufacturing was foundbringing 0.392 times the change in per capita GDP rate. This relationship was significant at 0.001 p-value and standard error of 0.096.
Table 10 Regression Coefficients of Annual GDP Growth Rate by Manufacturing and Per Capita GDP Change | ||||||
Model B | Unstandardized Coefficients | Standardized Coefficients | t | Sig. | ||
Std. Error | Beta | |||||
1 | (Constant) | 2.022 | .417 | 4.848 | .000 | |
Annual GDP growth rate by manufacturing | .392 | .096 | .737 | 4.083 | .001 | |
a. Dependent Variable: Annual change in per capita GDP | ||||||
Conclusion
‘Development perspectives’ were changing from the history of agricultural industries into large manufacturing industries, along the changing policies and approaches in global scenarios. Infrastructure development (road, transport, electricity, communication) were remained as ever green development perspectives, provisioned under national development plans. Newer concept of understanding development has brought about the newer terms as such: sustainability, equity, equality, inclusiveness and right based. New development terms (equality and inclusion) were found not complimentary to manufacturing sector, however sustainability was mandatory strategy for industrial growth. The national perspectives on industrial setting was found faint impression with these terms, however sustainability was evergreen agenda. The national development plans have envisioned for the future of industrial progress as cure to rampant poverty, balance growth, harnessing modern technology, enhancing skills and knowledge, competent human resources, globalization, and self-reliance of the country. Industries were explained as impediment to enhance national account while leading country into developing category. The infrastructure building for industrial establishment was evergreen issue found under all development plans. The development plans were found adopting fancy global development agenda, despite of national capacity and resources for their implementation. Newer development perspectives highlights on the nationalism in economic progress through GDP and Per capita measurement.
In the employment sector correlation between manufacturing and overall industries shows two tailed value of Pearson coefficient of 0.865 at 99 percent CI and 0.01 level of significance. Manufacturing sector explains 74 percent variability in total industrial employment. Annual GDP rate contributed by manufacturing was found strongly correlated with national GDP growth. Pearson coefficient was 0.737 at 99 percent CI. Coefficient of determination (R-square) shows 64 percent variability in national GDP rate by manufacturing sector. Similarly, 54 percent variability in the annual per capita GDP was found explained by manufacturing GDP growth. The Pearson coefficient for this causality was found to be 0.737 i.e. strong positively significant at 99 percent CI of two tailed test. At global as well as local level, manufacturing sector is important driver of per capita GDP. Despite the decreasing trend of manufacturing sector growth in Nepal, the correlation with Overall GDP growth rate and per capita GDP was found strong positive. The predictive regression lines can be helpful to understand the long run role of manufacturing. The further investigation on, including major sectors of GDP and their timeline projections, could be the new scope.
Acknowledgement
We would like acknowledge academic personals from mid-western university, who guided us ethically and encourage us to complete this research. Also, big thanks to Mr. Suresh Pradhan, who advised us for topic and objective defining.
References
Asian Development Bank - ADB. (2010). Overview of Gender Equality and Social Inclusion in Nepal. Philippines, Asia: Asian Development Bank
Adhikari, D. (2013). Gender Equality and Social Inclusion Mainstreaming Strategy. Kathmandu, Nepal: Deutsche Gesellschaft für Internationale Zusammenarbeit (GIZ) GmbH; Inclusive Development of the Economy Programme (INCLUDE).Incomplete
Akamatsu, K. (1962). A Historical Pattern of Economic Growth in Developing Countries. The Developing Economies,1(1), 3-25.
Alonso, J., & Glennie, J. (2015). What is development cooperation?Development Cooperation Forum, 1, 1-5.
Central Bureau of Statistics - CBS. (2001-15). 2003 Statistical Year Book Nepal. Kathmandu, Nepal: Central Bureau of Statistics.
____________. (2014). Development of Manufacturing Industries in Nepal: current state and future challenges.Kathmandu, Nepal: Central Bureau of Statistics.
Economics, T. (2016, December 31). Nepal: Economic Indicators. Retrieved from https://tradingeconomics.com/nepal/indicators
GoN/NPC. (2014). Graduation from the Least Developed Country by 2022. Kathmandu, Nepal: Government of Nepal, National Planning Commission.It doesnt appear in the text
International Council for Science - ICSU. (2015). Review of the Sustainable Development Goals: The Science Perspective.Retrieved fromhttps://council.science/cms/2017/05/SDG-Report.pdf
International Labour Organization - ILO. (2014). World of Work 2014: Developing with Jobs.Retrieved fromhttps://www.ilo.org/wcmsp5/groups/public/---dgreports/---dcomm/documents/publication/wcms_243961.pdf
Jain, D., Sanal, K., & Jain, V. (2015). Factors Affecting GDP (Manufacturing, Services, Industry): An Indian Perspective. Annual Research Journal of Symbiosis Centre for Management Studies, Pune, 3, 38-56.
Kapsos, S. (2005). The Employment Intensity of Growth: Trends and Macroeconomic Determinants. Geneva, Switzerland: Employment Strategy Department, International Labour Organization (ILO).
Khodabakhshi, A. (2011). Relationship between GDP and Human Development Indices in India. International Journal of Trade, Economics and Finance, 2(3), 251-253.
Kniivilä, M. (2008). Industrial development and economic growth: Implications for poverty reduction and income inequality.Retrieved fromhttp://www.un.org/esa/sustdev/publications/industrial_development/3_1.pdf
Singariya, M., &Sinha, N. (2015). Relationships among Per Capita GDP, Agriculture and Manufacturing Sectors in India. Journal of Finance and Economics, 3(2), 36-43.
MoF. (2016). Economic Survey. Kathmandu: Government of Nepal, MInistry of Finance.It doesn’t appear in the textpage 6 and 9
Ministry of Industry, Commerce and Supplies - MoICS. (2002). Industrial Development Perspective Plan Vision 2020.Retrieved fromhttps://www.moi.gov.np/downloadfile/Nepal_industrial_development_perspective_plan_2002_1505033875.pdf
Ministry of Urban Development - MoUD/GoN. (2013). Gender Equality and Social Inclusion (GESI) Operational Guidelines 2013. Kathmandu: Government of Nepal, Ministry of Urban Development.
National Planning Commission - NPC. (1992). The Eighth Development Plan 1992-97.Kathmandu,Nepal: National Planning Commission.
__________. (2017). Fourteenth Development Plan (2016/17-2018/19). Kathmandu, Nepal: National Planning Commission.
Pieterse, N. (2010). Development Theory, second Edition. London, UK.: Sage.
Pradhananga, M. (2007). A Review of Trade and Industrial Policy in Nepal. Kathmandu, Nepal: UNDP, SAWTEE.
Sharma, P., Guha-Khasnobis, B., & Khanal, D. R. (2014). Nepal Human Development Report 2014. Kathmandu, Nepal: National Planning Commission, UNDP.
Szirmai, A. (2010). Is Manufacturing Still an Engine of Growth in Developing Countries? 31 General Conference of The International Association for Research in Income and Wealth (pp. 1-44). St. Gallen: UNU-MERIT and School of Business and Economics, Maastricht University.
Szirmai, A. (2012). Industrialization as an engine of growth in developing countries, 1950-2005. Structural Change and Economic Dynamics, 23(4), 406-420.
United Nations - UN. (2003). National Accounts: A Practical Introduction. New York: United Nations’ Department of Economic and Social Affairs Statistics Division.It doesn’t appear in the text
__________ . (2015). Transforming our world: the 2030 Agenda for Sustainable Development. New York: United Nations General Assembly.it doesn’t appear in the text at page 5 of the text it has been cited
United Nations Industrial Development Organization - UNIDO. (2015). Industrial Development Report 2016. The Role of Technology and Innovation in Inclusive and Sustainable Industrial Development. Vienna, Austria: United Nations Industrial Development Organization.
Willis, K. (2005). Theories and Practices of Development. London, UK.: Routledge Taylor and Francis Group.